

Trends show that the Arctic region is warming at least twice as fast as most of the rest of the planet. This “Arctic amplification” means increased glacial melt, more frequent wildfires, permafrost thaw, and other widespread ecosystem disruption. In expansive and largely inaccessible regions like parts of Alaska, remote sensing methods have become a unique and invaluable way to collect data about Arctic amplification and highlight the importance of Arctic preservation. Many research groups are also turning to geodetic tools like GNSS and lidar to map trends in Alaska and call attention to these rapid changes.
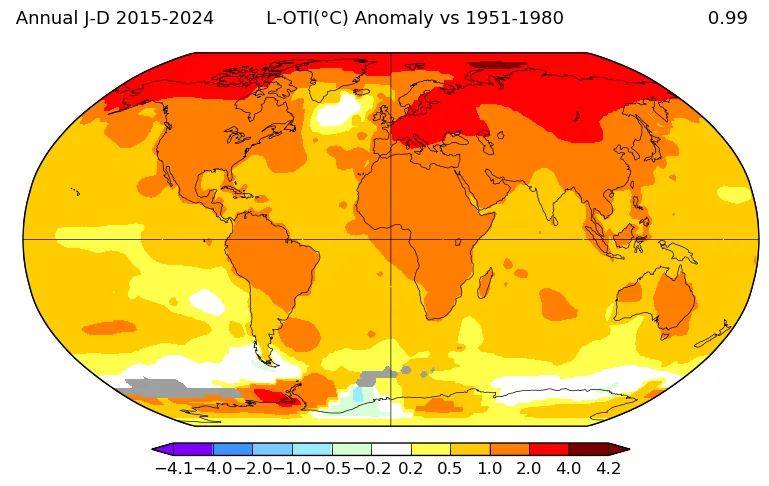
About a third of Alaska is in the Arctic circle, making it a key area for studying the impacts of climate change on high-latitude regions. Alaska is twice the size of Texas—it spans 20 degrees of latitude and 57.5 degrees of longitude. With so much land, there are obviously lots of diverse types of topography and biomes within it, including tundras, mountain ranges, and coastal plains, all having diverse and delicate wildlife. As warming continues to increase, the shifts in temperature and weather patterns can result in longer warm periods with record-high temperatures, which are detrimental to those many different ecosystems present within Alaska’s borders.
Carbon dioxide (CO2) is one of the most significant contributors to climate change. We rely on plants taking in CO2 and releasing oxygen. However, as changes in the environment impact flora, this can lead to changes in the CO2 levels present in our atmosphere. Seasonal shifts caused by climate change can place stress on the plants, especially in Alaska where it’s warming at twice the rate. They had adapted to the length and temperatures of their seasons before, but if the summers are too warm and dry, they can’t store CO2 as effectively. If these ecosystems become too dysregulated, they can shift from carbon sinks to carbon sources, releasing more CO2 into the atmosphere than they absorb.
Above and below the canopy
One research group is focusing on boreal forests in the Bonanza Creek Experimental Forest in Alaska with a goal of understanding how climate is impacting ecosystem processes. One member of the team, Jennifer Watts, Arctic Program Director at Woodwell Climate Research Center, emphasized that ecosystems like the ones in Alaska are slow to recover when stressed: “[the plants have] adapted to growing in these really cold environments with just a few month window every summer where it’s warm enough for plants to thrive. It becomes very lush and green, and then the snow comes back. So it’s a very complicated environment, full of contrast, very hot, warm summers where plants grow, and then the cold period. Now you have a lessening of the cold period constraints because of climate change. So we’re really interested in how these plants are adapting, and how they are becoming stressed.”
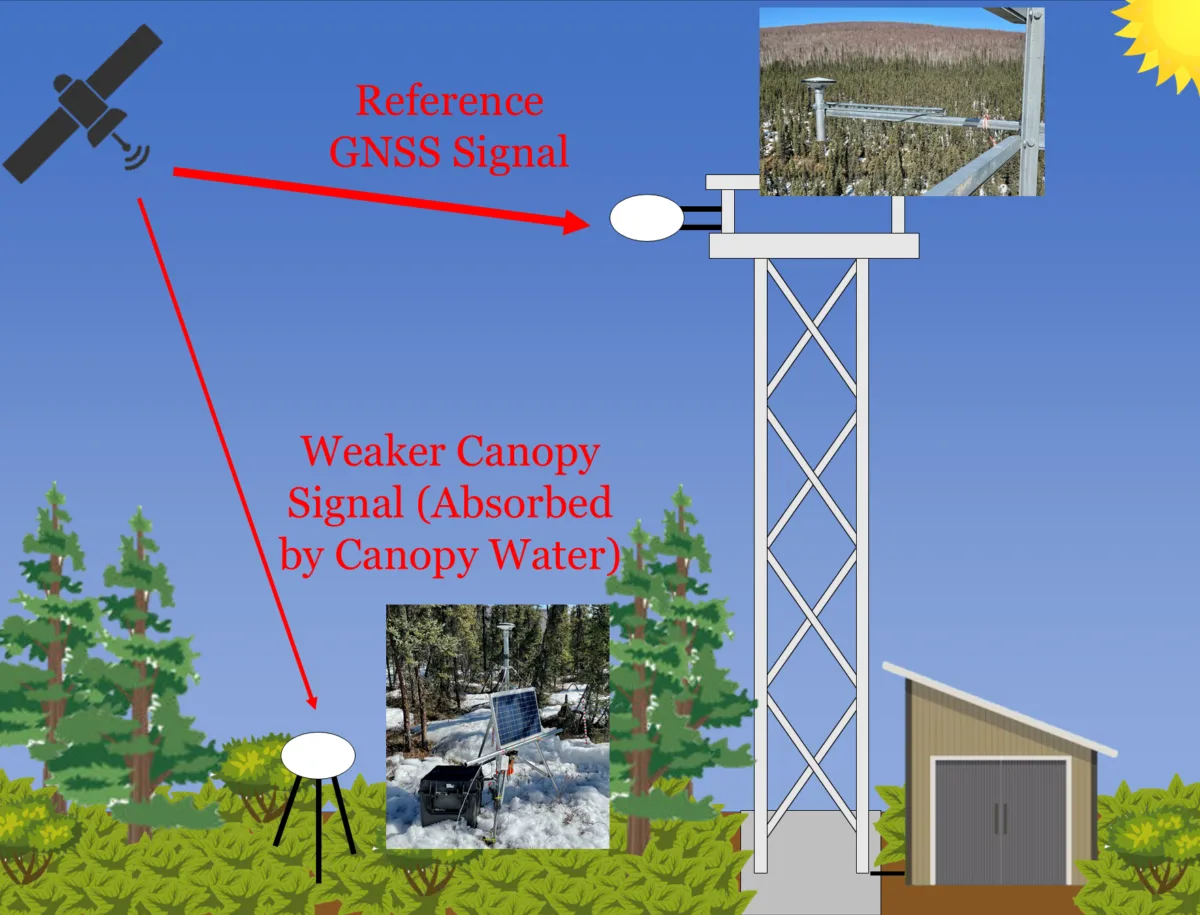
Supported by the NSF GAGE Facility operated by EarthScope, Watts’ research group is using GNSS instruments to track the water content of flora. Their sensors use signals from satellites in orbit to determine their location, just like GPS on cell phones. But because these microwave satellite signals are affected by vegetation on the way to the sensor, the noise in the data can serve as a measurement of that vegetation.
Another member of Watts’ team, PhD student Wayne Dawson, explained how it works: “we have these microwave sensors below the canopy and above the canopy. Because one of them is above the canopy, it’s going to have a very clear signal, it’ll be very strong. The one below the canopy is going to be subject to a bit of noise or errors, because it has all this plant material above occupying the signal. So by comparing the two, we can see that difference, and that difference should be correlated to water content in the leaves. So by using this, we can see how water content within plants is changing over time, which is going to be pretty strongly related to photosynthesis and overall plant functioning. They could also work as an index of drought.”
Additionally, they are looking at remote sensing data tracking photosynthesis. By looking at the data together they can monitor these processes and relate the plants’ water content to CO2 uptake. Dawson said that traditionally, this kind of data collection would require physically cutting off leaf samples to analyze and gather water content data, which is much more time consuming for the team, as well as invasive and harmful to the fragile ecosystems. Using GNSS instruments, instead, not only makes data collection more efficient, but also enables researchers to monitor changes over time with greater consistency, allowing a more comprehensive understanding of how the Arctic is responding to climate change.
Tracking thermokarst
CO2 accounts for about 80% of US greenhouse gas emissions, but another significant greenhouse gas is nitrous oxide (N2O). While much less N2O is emitted, it has a long life span and one pound of N2O warms our atmosphere about 300 times the rate of one pound of CO2, so it contributes the equivalent of around 6% of total US greenhouse gas emissions. Some of these N2O emissions can come from changing landscapes like Alaska and would only continue to increase with Arctic amplification, so quantifying sources of N2O emissions is essential for understanding how they might change in the future.
Another research group is focused on certain types of irregular terrain where N2O emission hotspots were observed—thermokarst-affected landforms. Thermokarst is an erosional process that is unique to permafrost, which covers about 85% of Alaska, so is very prevalent there. But Alaska is huge and parts of it are inaccessible, so walking around on foot or even with a rover to search for these certain irregular cracks in the ground would be incredibly time consuming and ineffective. So, they turned to remote sensing to assist their efforts.

A member of the team, Francia Tenorio, spoke about why they’re focusing mainly on N2O emissions: “Currently N2O has been considered negligible in Arctic ecosystems. There haven’t been many studies for the North Slope of Alaska. Our team has been the only one that’s been able to, that we know of, report N2O emissions from the North Slope and see that there is a strong signal. So that’s why we are really focusing on N2O mostly, because there is a signal and we don’t have enough observations. I want to contribute to establishing a baseline for this work given that it has a global warming potential that’s 273 times that of CO2. So if it’s not being currently accounted for in the climate models then we need to improve that.”
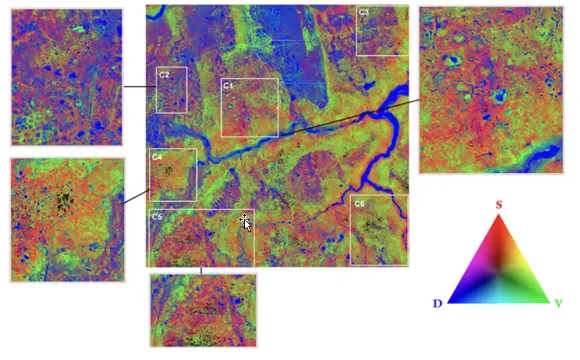
The team used a combination of hyperspectral imagery data and lidar data to create a detailed map of the ground surface. Hyperspectral imaging captures the light bouncing off of an area at different wavelengths, and can identify different materials on the surface. Lidar sends light pulses down, tracks their distances traveled, and can create precise 3D maps of areas. By combining the two methods, research teams like this one can render a 3D map of an area with specified surface properties. Then, the team used GPS instruments (provided by the NSF GAGE Facility) to collect ground-truth data for map validation purposes. After mapping these regions, they could easily identify thermokarst-affected landforms on the maps and measure N2O levels directly at the site.
Tenorio also spoke about how important it was to use these techniques in her efforts: “The advantage of having access to survey grade equipment is that it allows us researchers to go beyond the scope of what we currently have available within our research labs. It’s given me the opportunity to broaden the scope of my research interest and to be able to collect valuable information on quantifying the extent on the ground of these landforms that we don’t have very good estimates of currently.”
Remote sensing has been instrumental in identifying the effects of climate change in ways that would be extremely difficult, time consuming, and invasive through traditional fieldwork alone. As Jennifer Watts puts it, “From a global perspective, what happens in the Arctic doesn’t stay in the Arctic. What happens elsewhere on Earth impacts the Arctic.” Ultimately, the work of these scientists highlight the urgency of Arctic monitoring. The insights gained from these studies not only improve climate models, but also serve as a reminder that addressing emissions is more crucial than ever.